Consumer Financial Health Index
How American Households
Are Really Doing
Based on real-time behavioral data across 10M+ accounts
Q1 2026 Snapshot
Through March 2026
Inflation Pressure
Improving
CPI eased to 2.4% – consumers reallocated spend fast
Income Stability
Stable

Payroll penetration up 5–6pp; gig-to-payroll shift accelerating
Liquidity & Credit
Mixed

Lower cash flow segments stretched – the “fragile floor” bears watching
At a Glance
Resilient, Resourceful, and Recalibrating
American consumers entered 2026 on a relatively stable footing – but that stability is narrower than headline figures suggest. Our data shows a consumer that is adapting, and doing it faster than most macro surveys capture.
We see a two-speed, K-shaped economy: real stability for the top half, and high sensitivity for segments with tighter access to liquidity. This is not a consumer in crisis – it’s a consumer in transition.
Real Inflation Relief Through Q1
CPI hit 2.4% in February 2026, down from 2.8% a year earlier. Essential spending as a share of budgets declined through most of 2025, freeing up household budgets. Consumers responded quickly, reallocating spend with discipline.
Income Strengthening
Payroll income penetration rose 5–6 percentage points from its Jan 2025 baseline. Gig-to-payroll transitions are accelerating. The labor market is absorbing its own churn – 68% re-employed within 6 months.
Credit Stretched, Not Broken
Credit balances are growing modestly and delinquencies are stable. Lower cash-flow consumers show +12.2pp credit utilization – they’re using credit as a liquidity bridge, not a sign of distress.
What makes this different: We’re not using surveys. We’re watching money move in real time. Our aggregated cash flow based data provides a leading indicator of financial health that survey-based indices won’t surface for months.
Powered By
Data Snapshots
Inside the Numbers
Key trends from our real-time behavioral data across 10M+ consumer accounts.
Real Inflation Relief Through Q1
Percentage-point change in essential spending as share of total spend
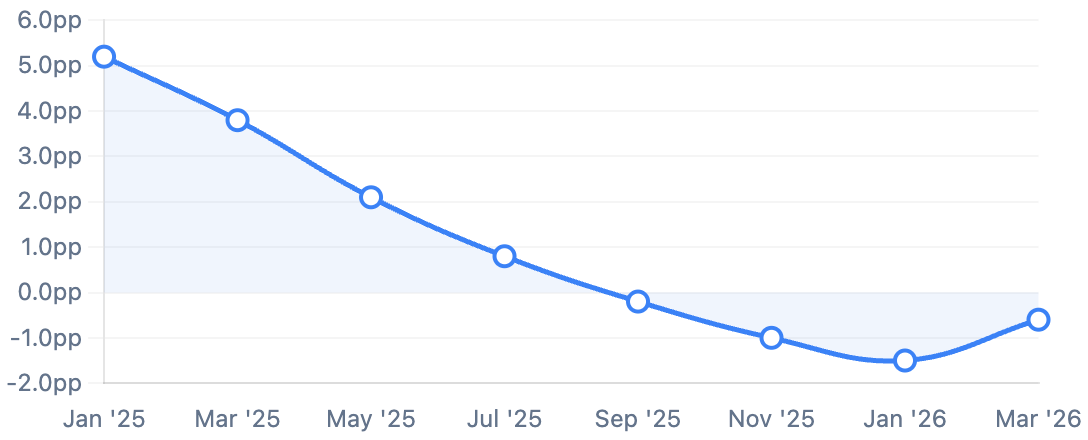
Key signal: Inflation relief was real through 2025, but a recent uptick in gas prices linked to Middle East tensions bears watching.
The Discretionary Pivot
YoY change in share of total spend (pp) – discretionary categories
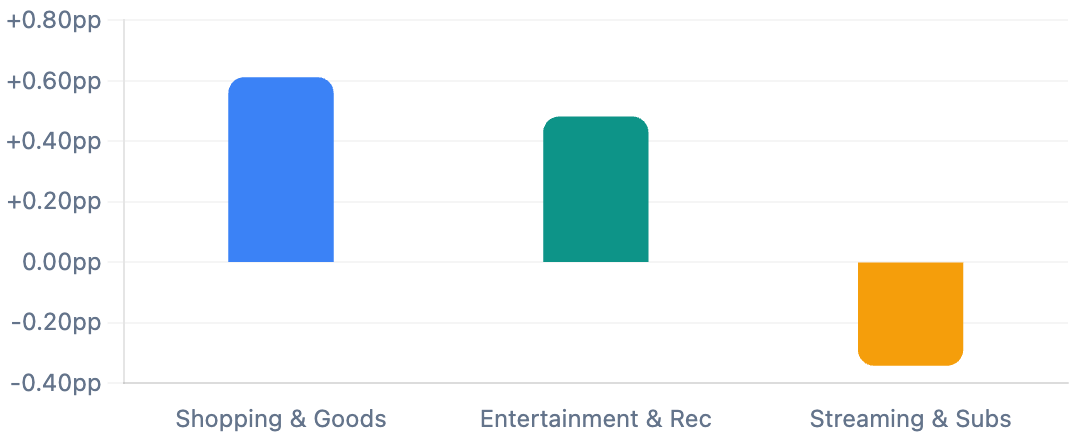
Key signal: Consumers are cutting at-home subscriptions (−0.34pp) to fund real-world experiences (+0.48pp) and physical shopping (+0.61pp).
Flight to Value: Retail Wallet Share
YoY change in share of total spend among top retailers
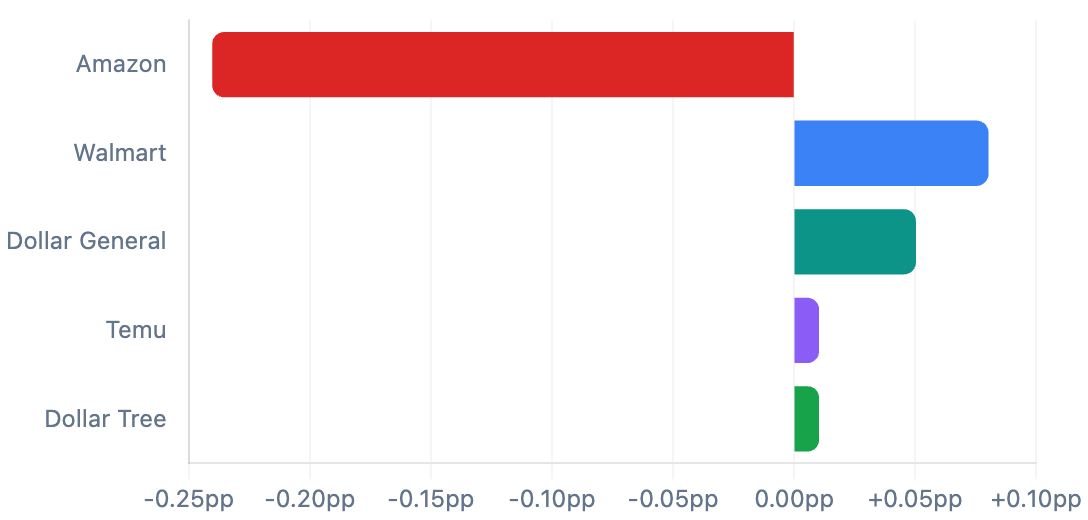
Key signal: Amazon contracted −0.24pp while Walmart, Dollar General, Temu and Dollar Tree all gained. Consumers are voting for value.
Credit Utilization: The K-Shape
Change in credit product utilization by cash-flow segment (pp)

Key signal: High cash flow accounts show controlled normalization +8.8pp. Low cash flow accounts have surged to +15.4pp – credit as a liquidity bridge, not distress.
Labor Market Resilience: Re-employment After Payroll Loss
Cumulative % of workers who regained payroll income after interruption
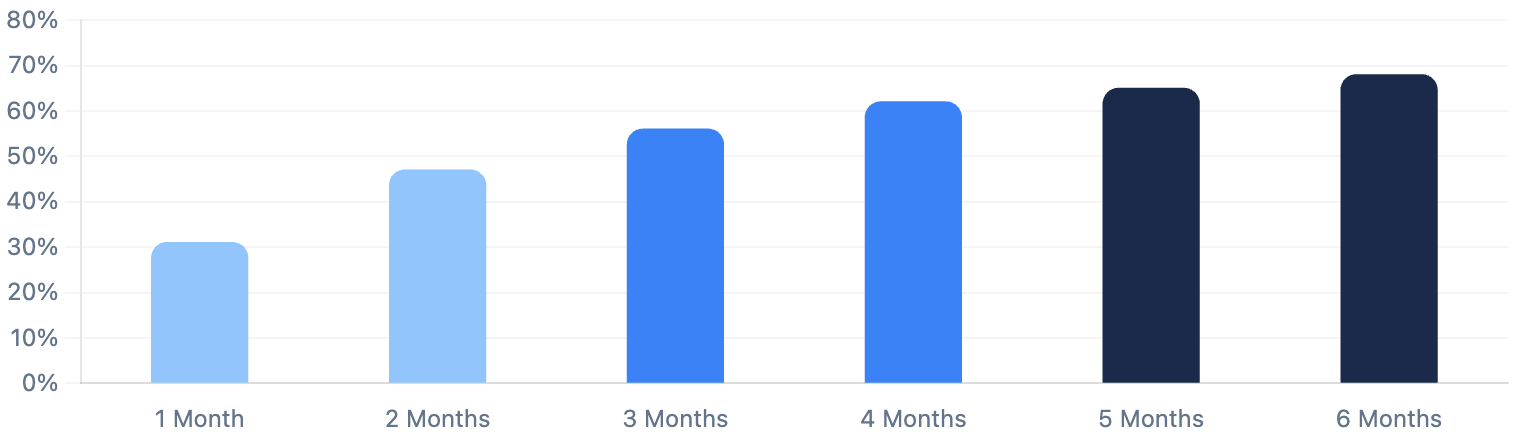
Key signal: 31% return within 1 month, 68% within 6 months. The labor market has friction, but it’s recovering well.
The “Fragile Floor” – A Canary In The Coal Mine
We define the “fragile floor” as the lower cash-flow consumer segment – not a demographic label, but a behavioral one. These are the high-sensitivity households that react first to every shift in gas prices, grocery costs, or paycheck timing. Their behavior today previews what the broader middle class may experience in 6 months if conditions deteriorate. It’s an early predictor for broader trends.
When liquidity deteriorates – it provides a window into what could become a broader trend for everyone in two quarters. This is because stress takes more time to show up across all segments. The high sensitivity segments give us the first leading insight into spikes in delinquency that can cascade into tightening across the entire credit spectrum.
+8.8pp
Credit utilization for high cash flow accounts
+15.4pp
Credit utilization for low cash flow accounts
Looking Ahead
What To Watch Next
Four signals that will shape the consumer landscape in Q2 2026 and beyond.
Post-Refund Liquidity (Q2)
Tax season provided a real cushion. Q2 will show the underlying baseline without it.
Energy Price Trajectory
The biggest near-term variable. If gas prices continue rising, inflation relief could stall.
Tighter Credit Segments
They are the leading indicator. If they stabilize, the broader consumer is likely fine.
Gig-to-Payroll Transition
If this holds, it represents a structural positive for household stability and income predictability.
Why This Index Is Different
The Atlas × Pave Consumer Health Index occupies a distinct position in the consumer financial data ecosystem. While established institutions provide valuable macro views, they rely on different inputs and serve different audiences.
Our real-time behavioral data fills the gaps left by traditional monthly, quarterly, and survey-based reports. We don’t ask people how they feel – we watch what they do with their money.
Behavioral Truth vs. Sentiment Noise
Survey indices measure how consumers feel. We measure what they do. Right now, sentiment is falling but our behavioral data shows adaptation, not failure.
The “Fragile Floor” as a Predictive Lens
Most reports view lower-income segments as risk. We focus on them as the economy’s early warning system, previewing what the middle class will experience in 3–6 months.
Focus on the Adaptive Consumer
Our cohort skews toward mainstream, fintech-savvy consumers – the first to adopt private-label brands, optimize credit, and time spending around pay cycles.
Real-Time Behavioral Advantage
BLS data carries a 30–60 day lag. Bank reports are monthly or quarterly. We capture behavioral shifts as they happen – before they appear in CPI, surveys, or bureau reports.
Competitive Landscape
How We Compare
A snapshot of the major consumer health data sources and what each captures.
| Report | Source Type | Key Focus | Q1 2026 Finding |
|---|---|---|---|
| BofA Consumer Checkpoint | Transactional (Internal) | Household spending & wage growth | Noted a “K-shaped” divergence between high and low-income households. |
| CivicScience CFHI | Survey-based | Consumer sentiment & outlook | Reported a decline in perceived financial health, even as actual behavior remained adaptive. |
| Equifax Consumer Pulse | Credit Bureau | Debt & delinquency | Focused on rising debt surpassing $18T. Framed growth as systemic risk. |
| J.P. Morgan Asset Mgmt | Macro Analysis | Income & spending forecasts | Forecasted slow spending growth, highlighted deficit-financed tax refund impact. |
| Philly Fed LIFE Survey | Survey-based | Expectations & cutbacks | Showed decreased optimism – a sentiment signal that diverges from actual behavior. |
| Atlas × Pave Index | Real-time Behavioral | Cash flow, spend & credit behavior | Consumer is stable but adapting actively. Behavioral data reveals resilience that surveys and bureau data miss. |
