
Your Risk Models Are Punishing Timing, Not Credit Risk
Pave analyzed 360,000+ failed BNPL payments across ~100K borrowers and found that more than 1 in 3 missed payments aren't credit events — they're due dates that landed at the wrong point in a pay cycle.
Delinquency signals are distorted by paycheck timing
Traditional underwriting treats every missed payment as a signal of deteriorating credit quality. This study reveals that's often wrong.
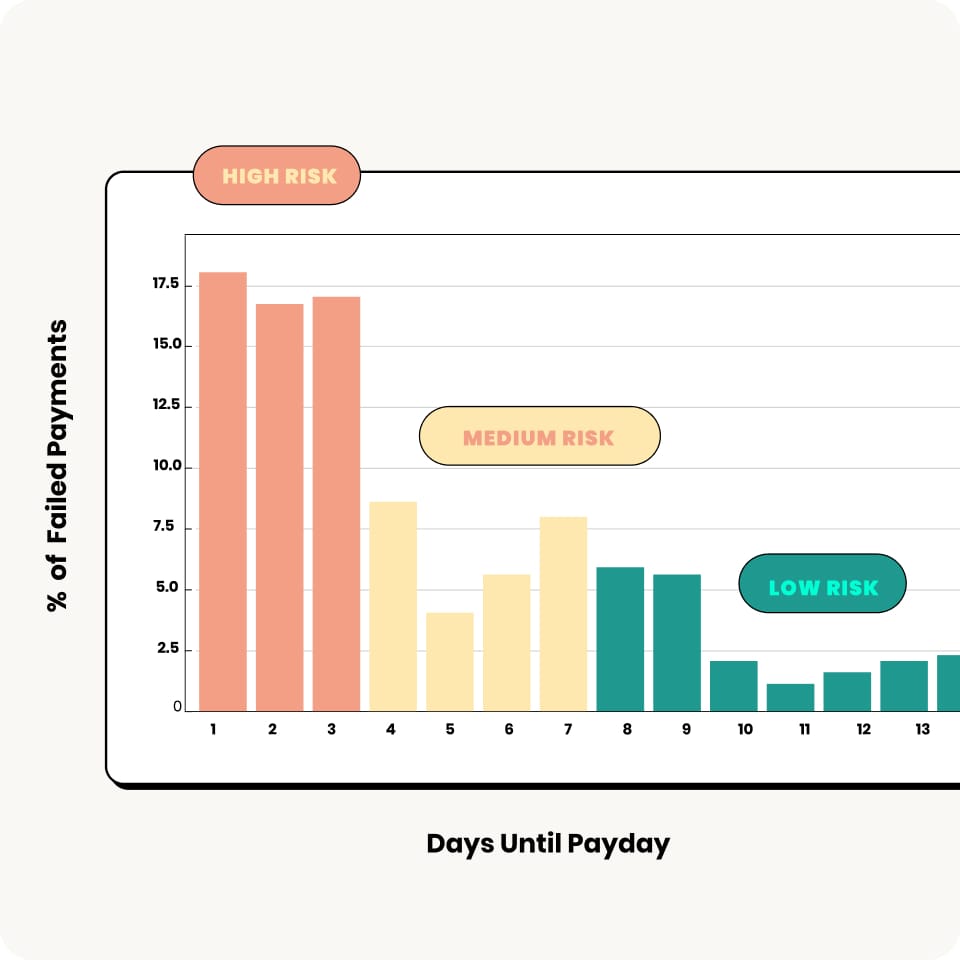
Failure rates start at 1.2% on payday and climb to 8.2% by day 11. The borrower population doesn't change — only where in the cycle the payment lands.
They're due dates that landed at the lowest liquidity point in a predictable income cycle. Most would have cleared just days later when income posted.
Borrowers whose payments are misaligned with payday generate ~$500 less annual spend and complete 12 fewer transactions per year — suppressed activity from avoidable friction.
For borrowers who failed pre-payday, cash positions jumped ~$980 when income posted. The average BNPL payment is just $33 — well within post-payday liquidity.
Running low before payday isn't a sign of credit weakness. It's a feature of getting paid every two weeks.
Treating predictable short-term liquidity gaps as structural credit deterioration creates real costs for both borrowers and lenders — without improving risk outcomes at all. This report shows you exactly where it's happening and what to do about it.
Get the Full AnalysisFailure rates climb 7× within a single pay cycle — same borrowers, different timing.
The full report breaks down exactly where, why, and what risk teams can do about it — across 360K+ failed payments and ~100K borrowers.
Read the full report
11 pages of data, charts, and policy implications for risk teams rethinking how they classify missed payments.