Frequently Asked Questions
Get answers to common questions about Pave.
For more details, feel free to contact us.

Getting started
Pave ingests raw bank transactions, balances, and other signals, cleans and enriches them into decision‑ready attributes, and applies product‑specific scores so you can approve more good borrowers while reducing losses. In practice, this yields higher‑quality approvals, fewer bad outcomes, and faster time‑to‑decision without extra engineering burden.
Aggregators move raw data but don’t make decisions; BI tools visualize inputs but don’t resolve data‑quality and modeling gaps. Pave turns raw feeds into reliable attributes, scores, and explainability designed specifically for underwriting and collections, reducing manual triage and tightening the loop from insight to production action.
Consumer personal loans, earned‑wage access/cash advance, and SMB credit. Each has domain‑specific attributes (for example, next‑pay and pay‑frequency for EWA; affordability and DSCR‑style trends for SMB) and score configurations.
Stronger income detection to reduce false negatives and lift approvals, ACH timing to cut returns and fees, and threshold tuning on top cohorts to unlock yield with bounded risk. We stage these in weeks, then expand with KPI guardrails.
Yes. Portfolio and cohort views, deciles, and reason codes enable policy evaluation without SQL. Leaders get KPI summaries, analysts export artifacts, and engineers wire a stable endpoint—supporting fast pre‑reads and decisive live reviews.
Approvals, delinquency and returns, expected loss, net yield, CAC‑to‑approval, and time‑to‑value. We structure readouts against these KPIs with attribution to policy changes.
Data sources and enrichment
We start with your reality: bank transactions and balances (aggregators or statements), then layer in credit bureau features, loan tapes, processor events, and self‑reported data. You can begin with SFTP/warehouse exports and graduate to Pave APIs for real‑time attributes and scoring as you scale.
We recommend 6–12 months to capture seasonality and pay cycles. If you only have 90 days, we can produce directional results and clearly call out confidence limits. During rollout, feature windows are standardized and point‑in‑time labeling is documented for reproducibility.
We unify accounts at the borrower level, deduplicate overlapping signals, and prevent double counting inflows that move between a user’s own accounts. For co‑borrowers, we expose combined‑ and per‑borrower views so policy can consider shared obligations while retaining auditability.
We normalize merchants and MCCs, reconcile display vs clean names, extract store numbers and locations, and align timestamps with recurrence. Missing fields are surfaced with staleness/confidence and conservative fallbacks; any imputation is labeled so it never masquerades as raw facts.
Coverage is the share of traffic with high‑confidence tags, merchants, MCCs, and locations. We publish coverage dashboards, track precision/recall, and show how changes affect downstream lift so you can prioritize the highest‑ROI fixes.
Golden datasets, regression tests, human‑in‑the‑loop checks for high‑impact domains (payroll, rent, utilities), and partner side‑by‑sides with precision/recall metrics to keep improvements durable.
A hybrid of regex extraction and NER with place‑matching against references, shipped with precision/recall tracking on golden sets to quantify gains and avoid regressions.
Modeling, calibration, and explainability
Yes. Most customers ensemble Pave with in‑house or bureau scores. We provide score‑to‑score maps, decile tables, and threshold simulations so you can introduce Pave as an additive signal and later converge on a unified policy when desired.
Every change goes through staged gates: offline validation on recent holdouts, parity checks against prior versions, fairness and bias scans on protected segments, and performance stability by cohort. We then run a shadow test to confirm live payload parity, followed by a limited rollout with KPI bands and automatic rollback triggers. Promotion requires documented results and sign‑off from Product, Risk, and Engineering.
Yes. Decisions expose top drivers mapped to reason‑code language and human‑readable attributes. Declines can export compliant adverse‑action text; approvals can capture policy notes for borderline passes.
We build a score‑to‑score mapping over representative windows, confirm offers and declines align to objectives, and then flip the decision source to avoid distribution shocks.
Yes. We translate model effects into portfolio KPIs with odds‑to‑default tables and before/after decision examples so non‑technical leaders can sign off confidently.
Features are computed with explicit as‑of timestamps anchored to underwriting dates, and labels exclude post‑decision information. Holdouts and shadow runs confirm live behavior matches backtest assumptions.
We check cohort mix, data freshness, and routing, then evaluate calibration and thresholds. If the population shifted, we recommend targeted recalibration or a short retrain, validated in shadow with KPI bands.
Modeling, calibration, an Backtesting, evaluation, and liftd explainability
If you have 6–12 months of transactions and outcomes (even approvals‑only), we typically return a first backtest in 1–3 weeks. The readout covers approvals, 5/15/30‑day delinquency, ACH returns, and expected loss by cohorts and amount buckets, then highlights quick wins for shadow and A/B.
Denied applicants remove bias and strengthen calibration, but they’re not required to start. Many teams begin with approvals and add reject inference later. We document trade‑offs, run sensitivity checks, and incorporate denials when you’re ready so thresholds reflect the true decision frontier.
Backtest to quantify potential, shadow test to harden data flows and calibrations, then a controlled A/B that isolates the score or policy change, with weekly reviews and pre‑agreed stop/go criteria.
We track approvals, 5/15/30‑day delinquency, ACH returns, expected loss, and net yield, segmented by amount bucket, tenure, channel, and cohort. We include confidence bands so you can tune thresholds against portfolio objectives.
Approvals, delinquency and returns, expected loss, net yield, CAC‑to‑approval, and time‑to‑value. We structure readouts against these KPIs with attribution to policy changes.
Yes. Example requests and responses for attributes and scores, plus SFTP schemas for batch, are ready to drop into Postman and integration tests.
Deployment, APIs, and rollout
Yes. Start with SFTP/warehouse exports for speed; graduate to real‑time endpoints once value and governance are proven. Schemas are versioned across both modes to avoid rework.
Once A/B KPIs are met, finalize thresholds, lock governance and monitoring, expand coverage, and align finance and product on pacing and volume. Maintain a regular performance cadence to keep rollout controlled.
Coverage is the share of traffic with high‑confidence tags, merchants, MCCs, and locations. We publish coverage dashboards, track precision/recall, and show how changes affect downstream lift so you can prioritize the highest‑ROI fixes.
Each field has a versioned contract and deprecation window. We publish change notes, run regression suites, and provide pre‑release testing so downstream systems don’t break mid‑quarter.
We document which fields power the UI versus decisions, use feature flags for risky changes, and provide side‑by‑side payloads to reconcile behavior and align partner expectations.
We degrade gracefully with alerting, retries, safe cache fallbacks, and clear status for Ops and Support. Post‑incident, we document root cause and prevention.
Collections and payment timing
Yes. By combining observed cadence with inflow variance and pay‑window heuristics, we predict the next expected pay date per user. Teams schedule ACH attempts when balances are likely sufficient, reducing returns and improving recovery without adding friction.
We provide an ACH return‑risk score with timing recommendations to route high‑risk cases to safer strategies and schedule attempts around cash arrival. With debit‑vs‑ACH decisioning and capped retries, teams typically see fewer NSFs, lower processing costs, and steadier cash flow.
Combine return‑risk and next‑pay predictions to stage attempts when balances are likeliest to clear and cap retries to avoid fatigue—easy to A/B against your current cadence.
Yes. We codify on‑time and late windows, support partial payments, and tune by channel. For high‑stakes uses (tenant screening, reporting), we pair models with rules and validation sets to maintain precision.
Use per‑account snapshots reconciled to transactions; if we must impute, we label it clearly and quantify sensitivity so decision makers and Compliance understand influence.
Rules flag primaries (recurring payroll, spend share), and borrower‑level aggregates weight them appropriately. Logic is auditable and tunable to your portfolio.
Segmentation and policy tuning
Yes. Policy curves by channel, tenure, pay frequency, and amount bucket—with guardrails—let you tune approvals to strategic segments while protecting portfolio quality.
Yes. We provide bucket‑specific deciles and policy curves and guard against sparse data so you don’t over‑fit small cohorts.
We build a score‑to‑score mapping over representative windows, confirm offers and declines align to objectives, and then flip the decision source to avoid distribution shocks.
Stronger income detection to reduce false negatives and lift approvals, ACH timing to cut returns and fees, and threshold tuning on top cohorts to unlock yield with bounded risk. We stage these in weeks, then expand with KPI guardrails.
Yes. Most customers ensemble Pave with in‑house or bureau scores. We provide score‑to‑score maps, decile tables, and threshold simulations so you can introduce Pave as an additive signal and later converge on a unified policy when desired.
Yes. We translate transaction streams into SMB‑appropriate affordability and stability features and augment with statements when needed—supporting automated or analyst‑assisted flows.
Monitoring, reliability, and governance
We track data freshness, attribute latency, score distribution health, approval/return swings, and cohort mix. Alerts include context for quick diagnosis; weekly reviews summarize trends and actions.
We monitor input distributions, live AUC/KS, decile stability, and cohort composition. Divergence triggers calibration or threshold remapping; material shifts trigger a retrain on recent cohorts, validated in shadow before ramping, with rollbacks and written rationale for governance.
Commercial levers (tiered pricing, staged rollouts) plus technical levers (payload minimization, selective recompute, caching for high‑volume paths). We size both and set a no‑surprises schedule.
We minimize PII, encrypt in transit/at rest, enforce least‑privilege and audit trails, separate raw sources from decision artifacts, and document lineage, reason codes, and adverse action support for regulated workflows.
Strong data governance, clear lineage, versioned models and endpoints, explainability, and adverse action support—suited to partner and regulator reviews—shorten approvals and reduce re‑work.
Each field has a versioned contract and deprecation window. We publish change notes, run regression suites, and provide pre‑release testing so downstream systems don’t break mid‑quarter.
Transform your data sources into Attributes and Scores
Discover how to accelerate your model development from months to days.
Explore More Products
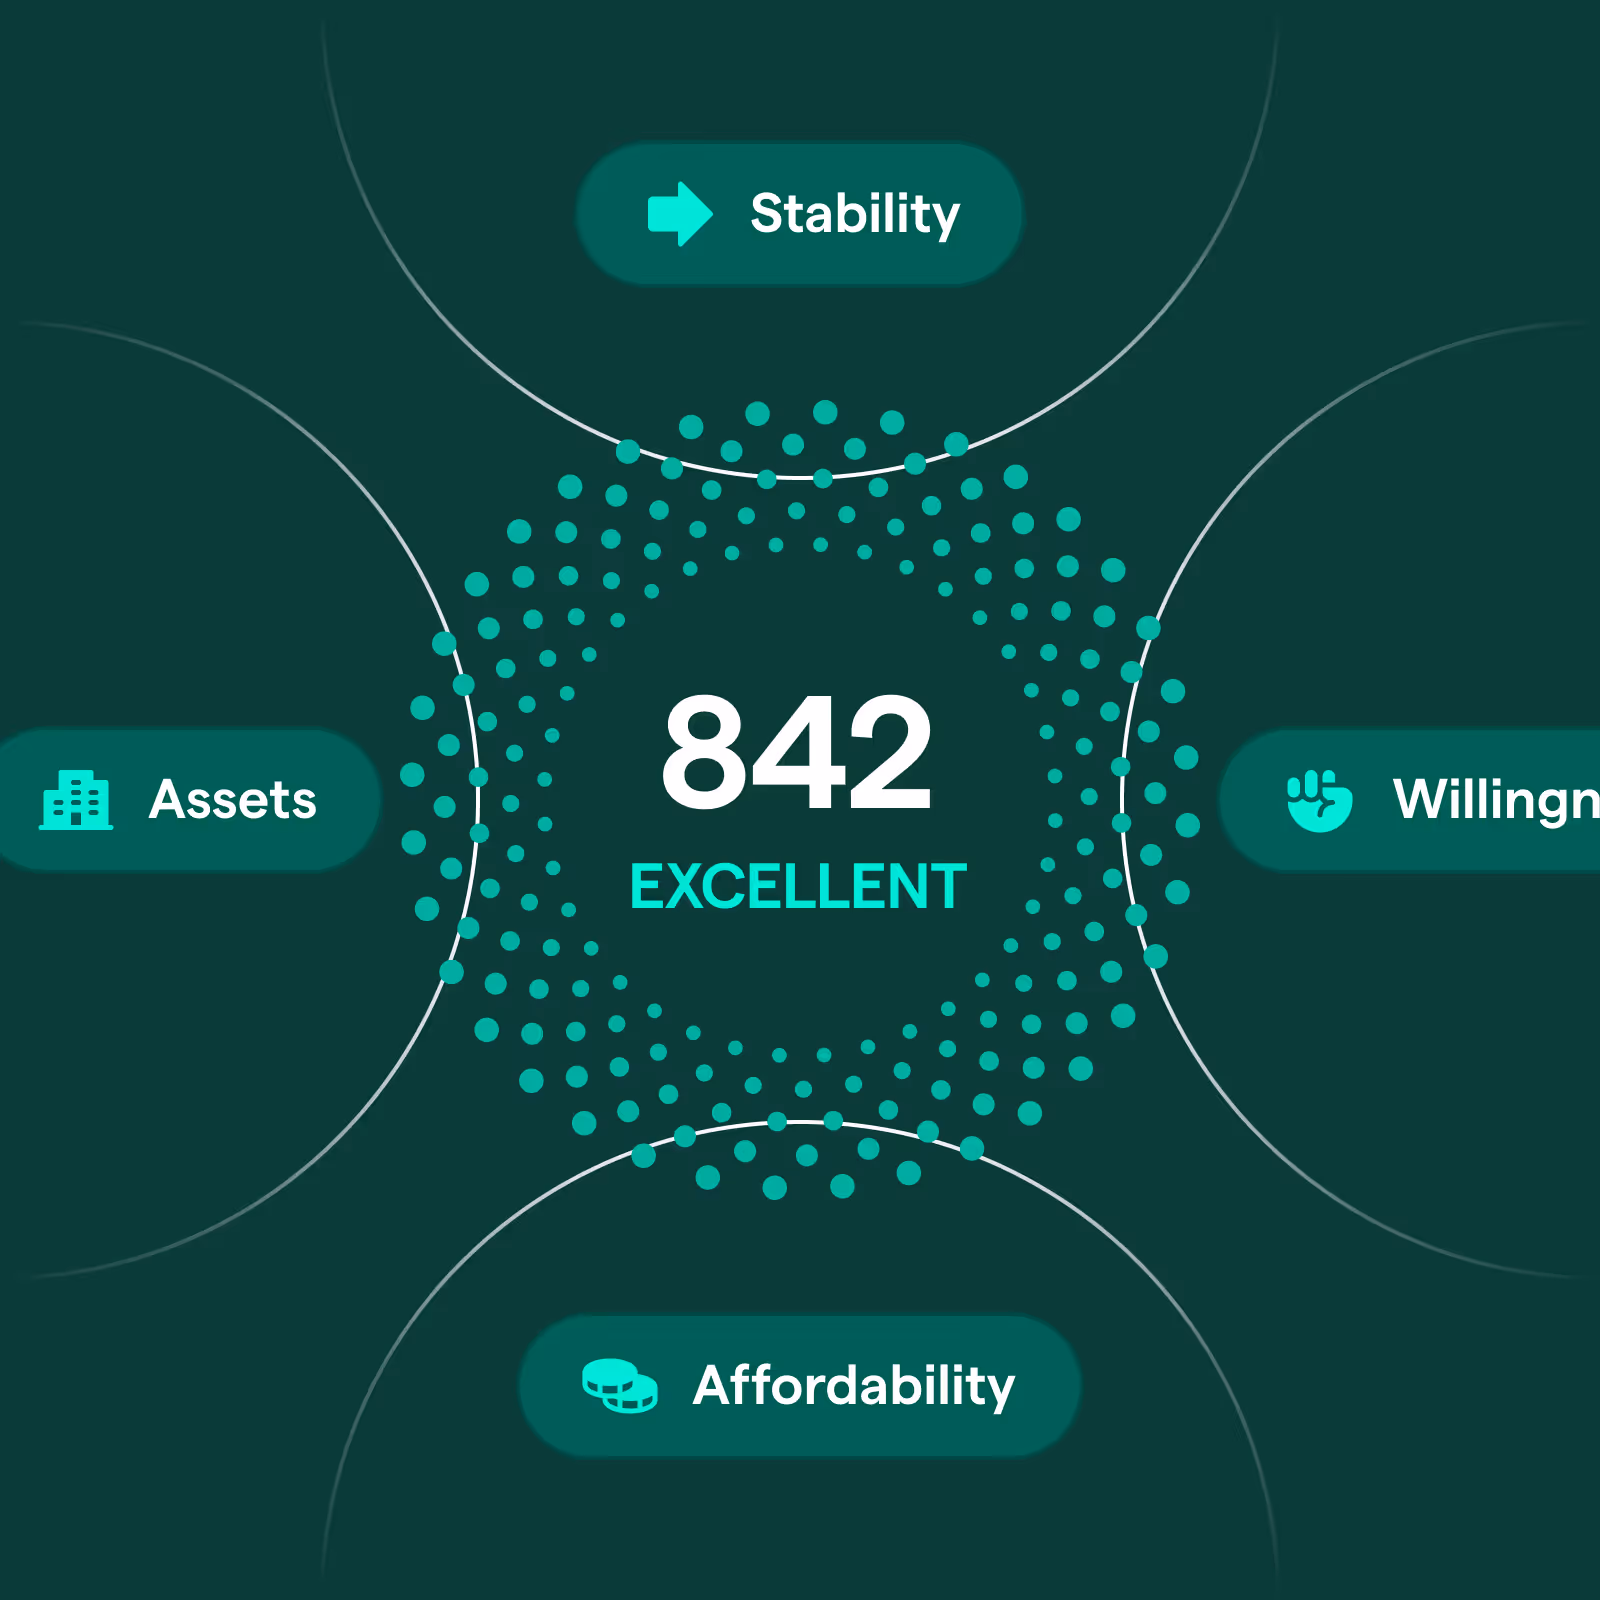
Cashflow Scores
Offer higher amounts and drive growth with our Cashflow Scores, built on Cashflow Attributes and repayment history. Increase approvals and retention by identifying healthy, underserved borrowers.
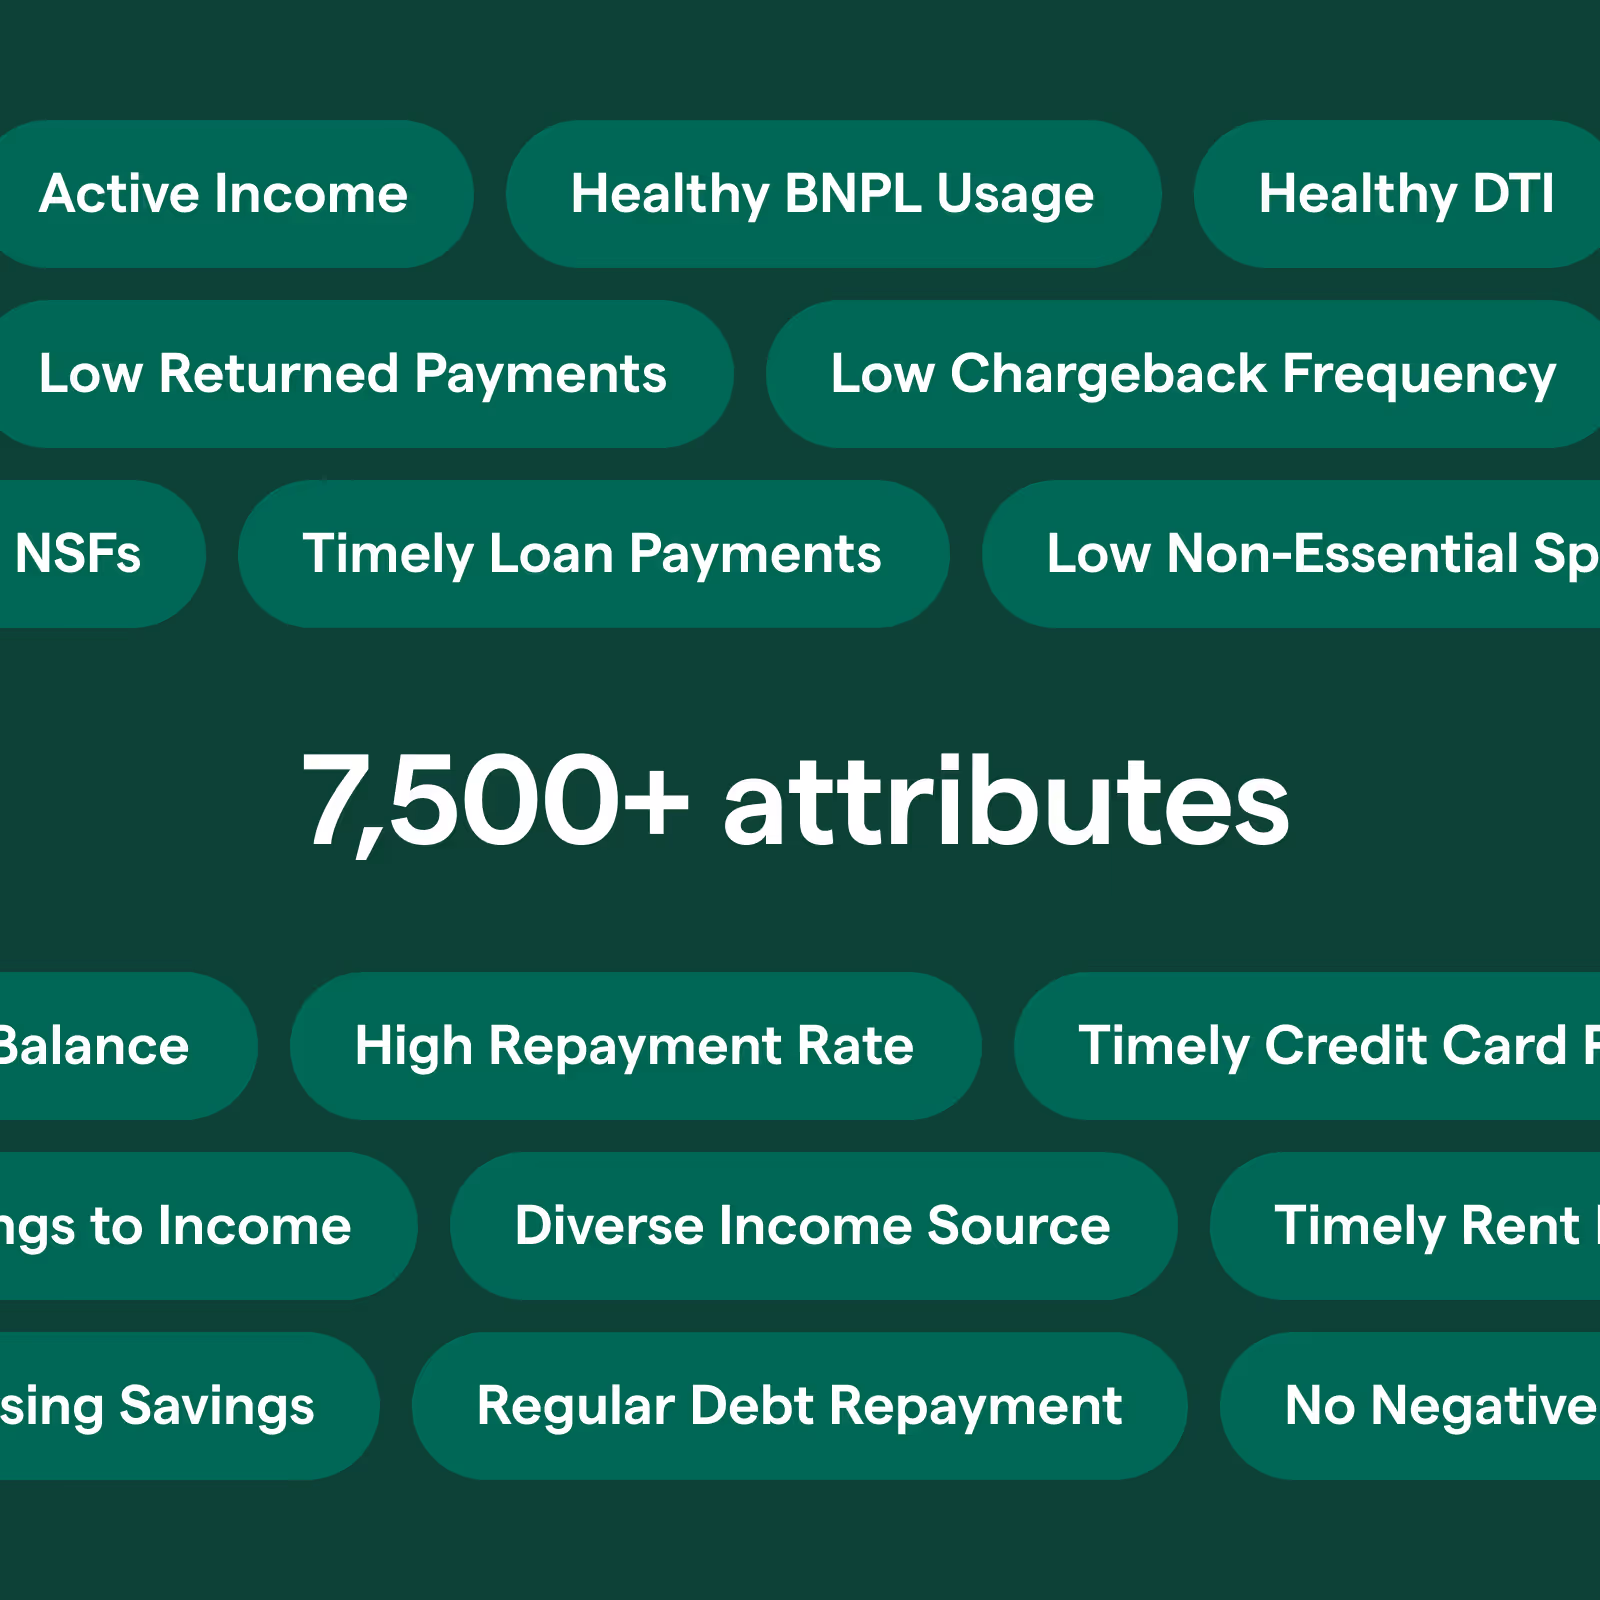
Cashflow Attributes
Drive lift in your risk models to boost approvals with thousands of pre-built attributes built on our expansive loan performance dataset.
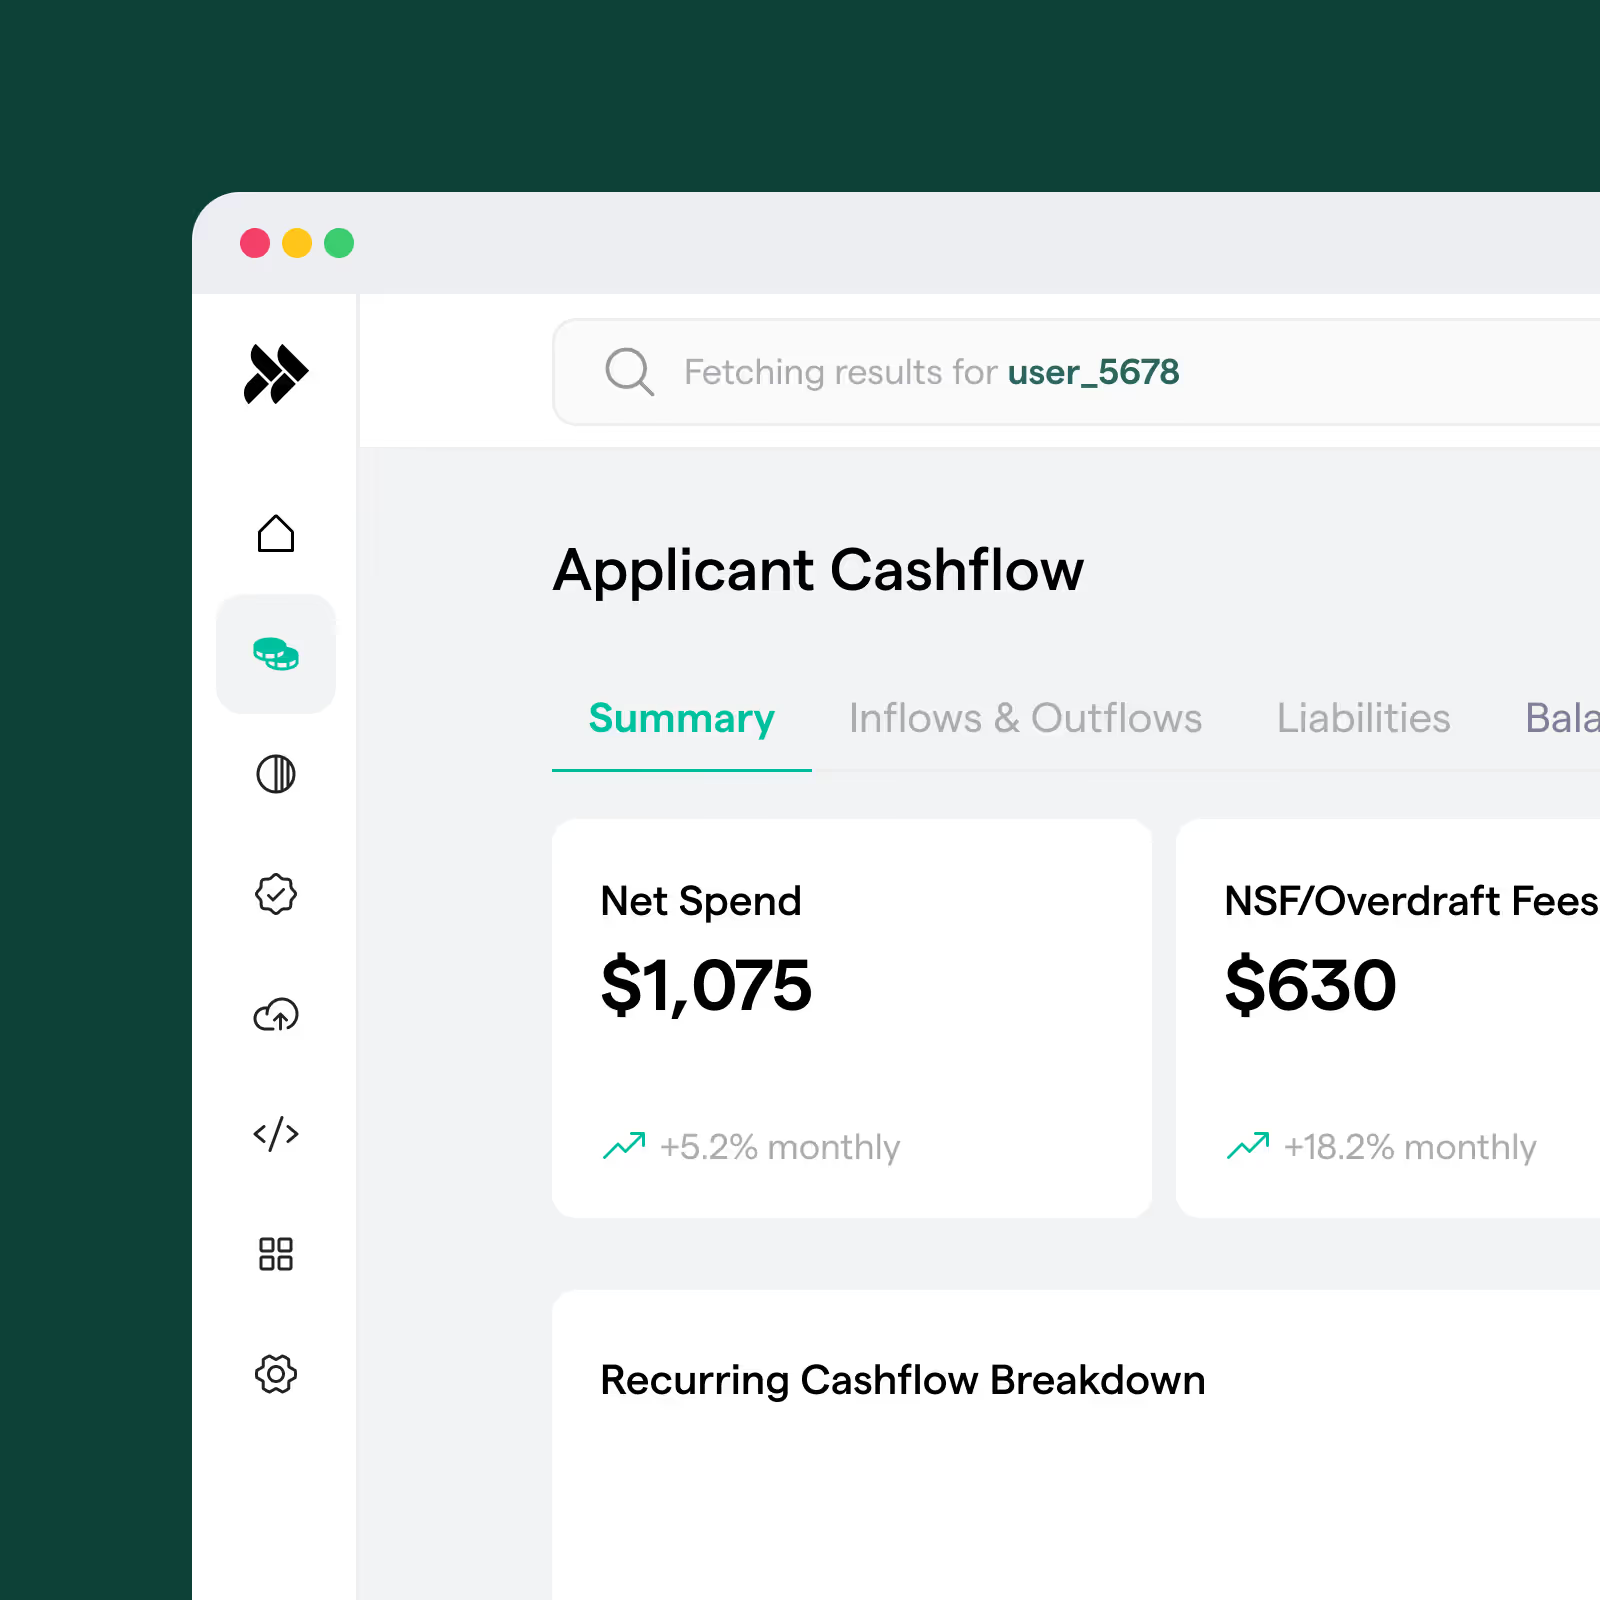
Cashflow Analytics
Automate processes to increase approvals and serve more borrowers using Pave’s real-time Cashflow Analytics. Streamline operations and identify healthy, underserved borrowers.
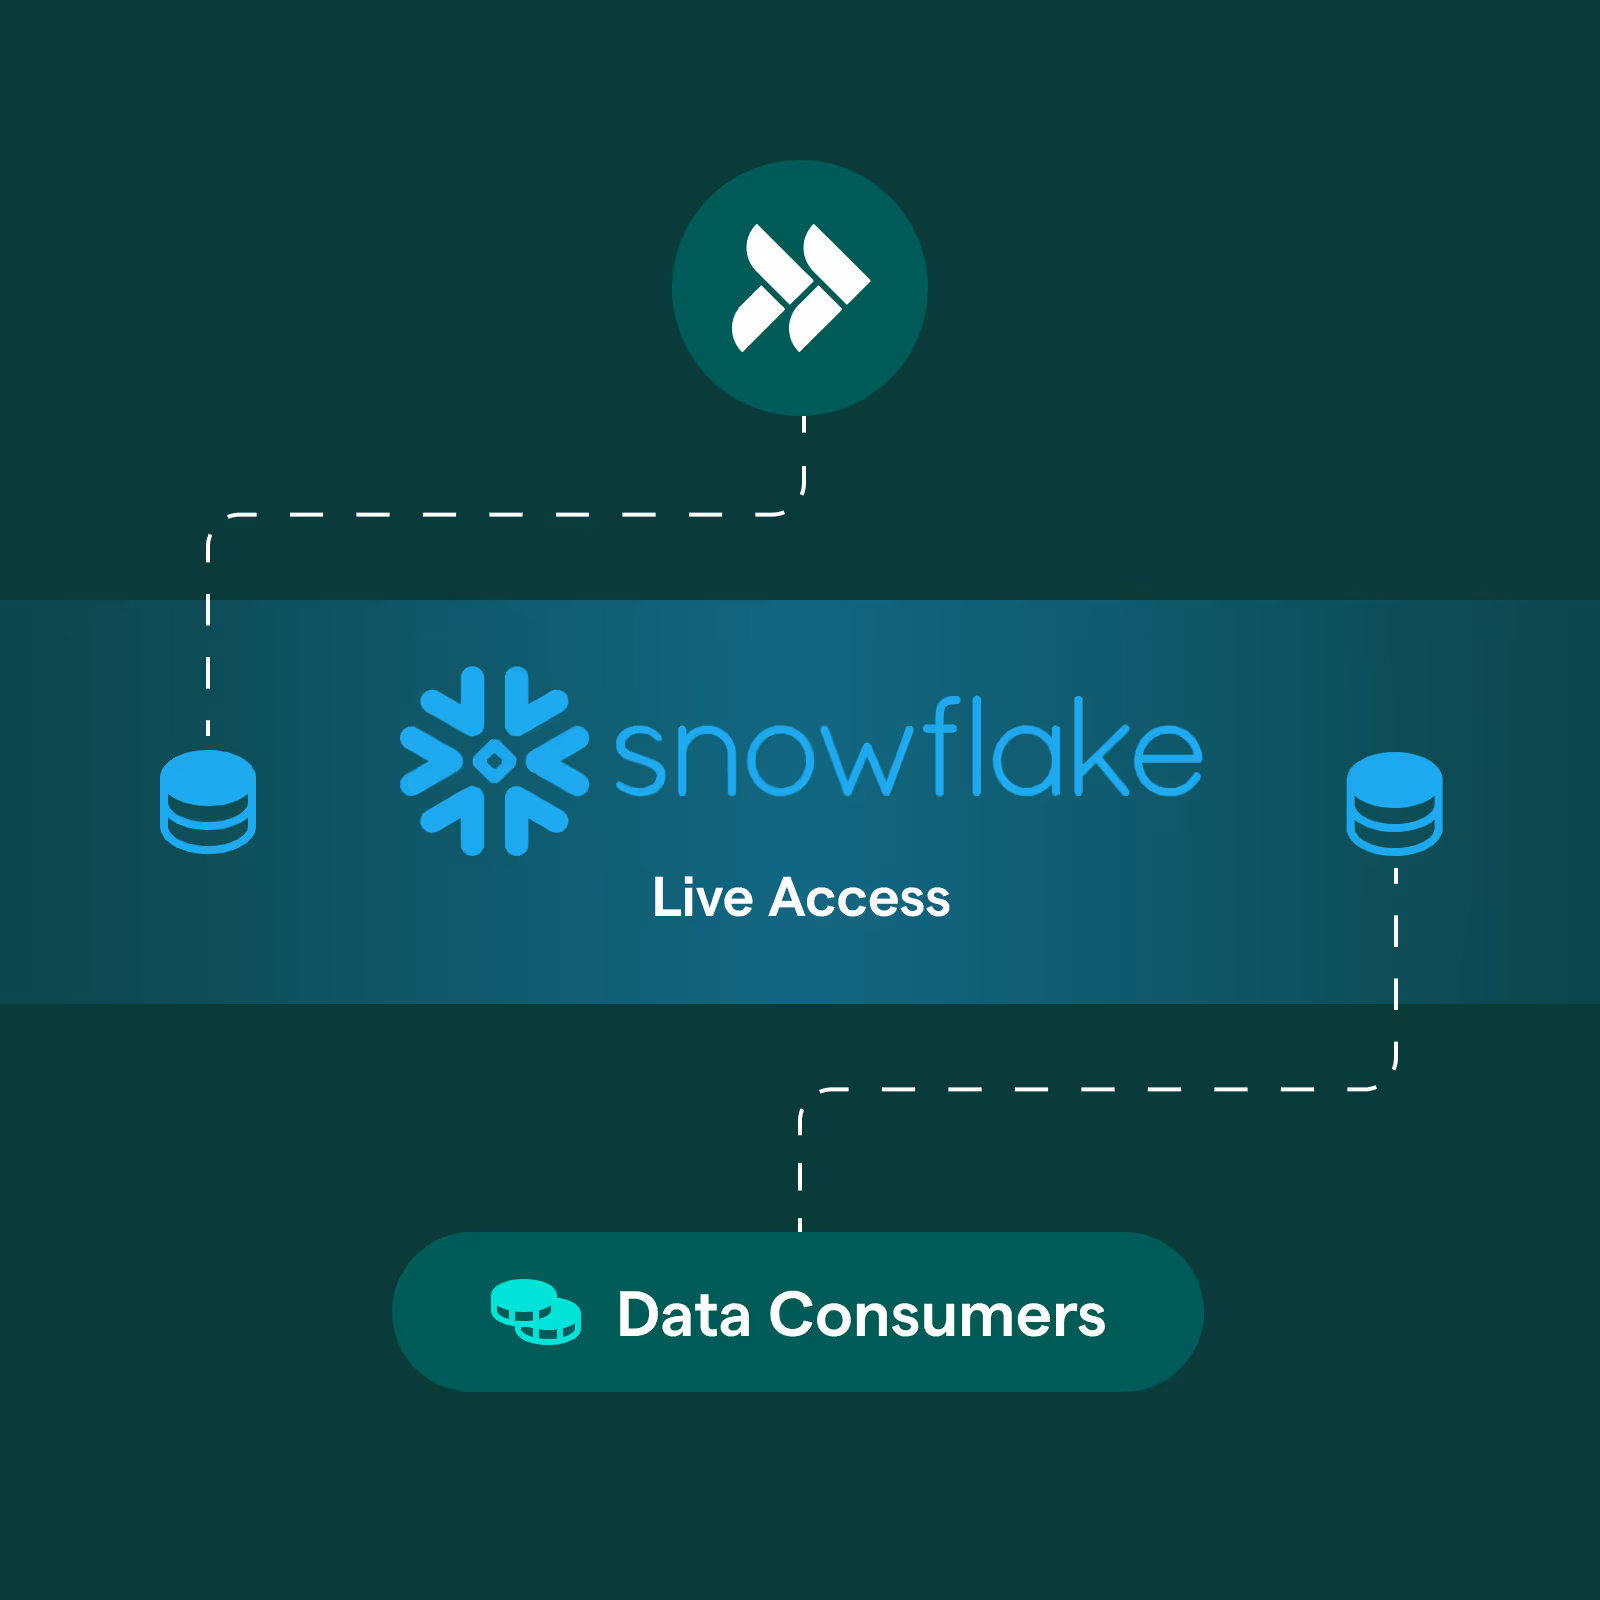
Cashflow Analytics in Snowflake
Gain seamless access to cashflow data within Snowflake to enhance analysis and decision-making. Leverage Pave’s standardized tables, updated daily, to uncover insights without complex ETL.